Dashboard & Stats
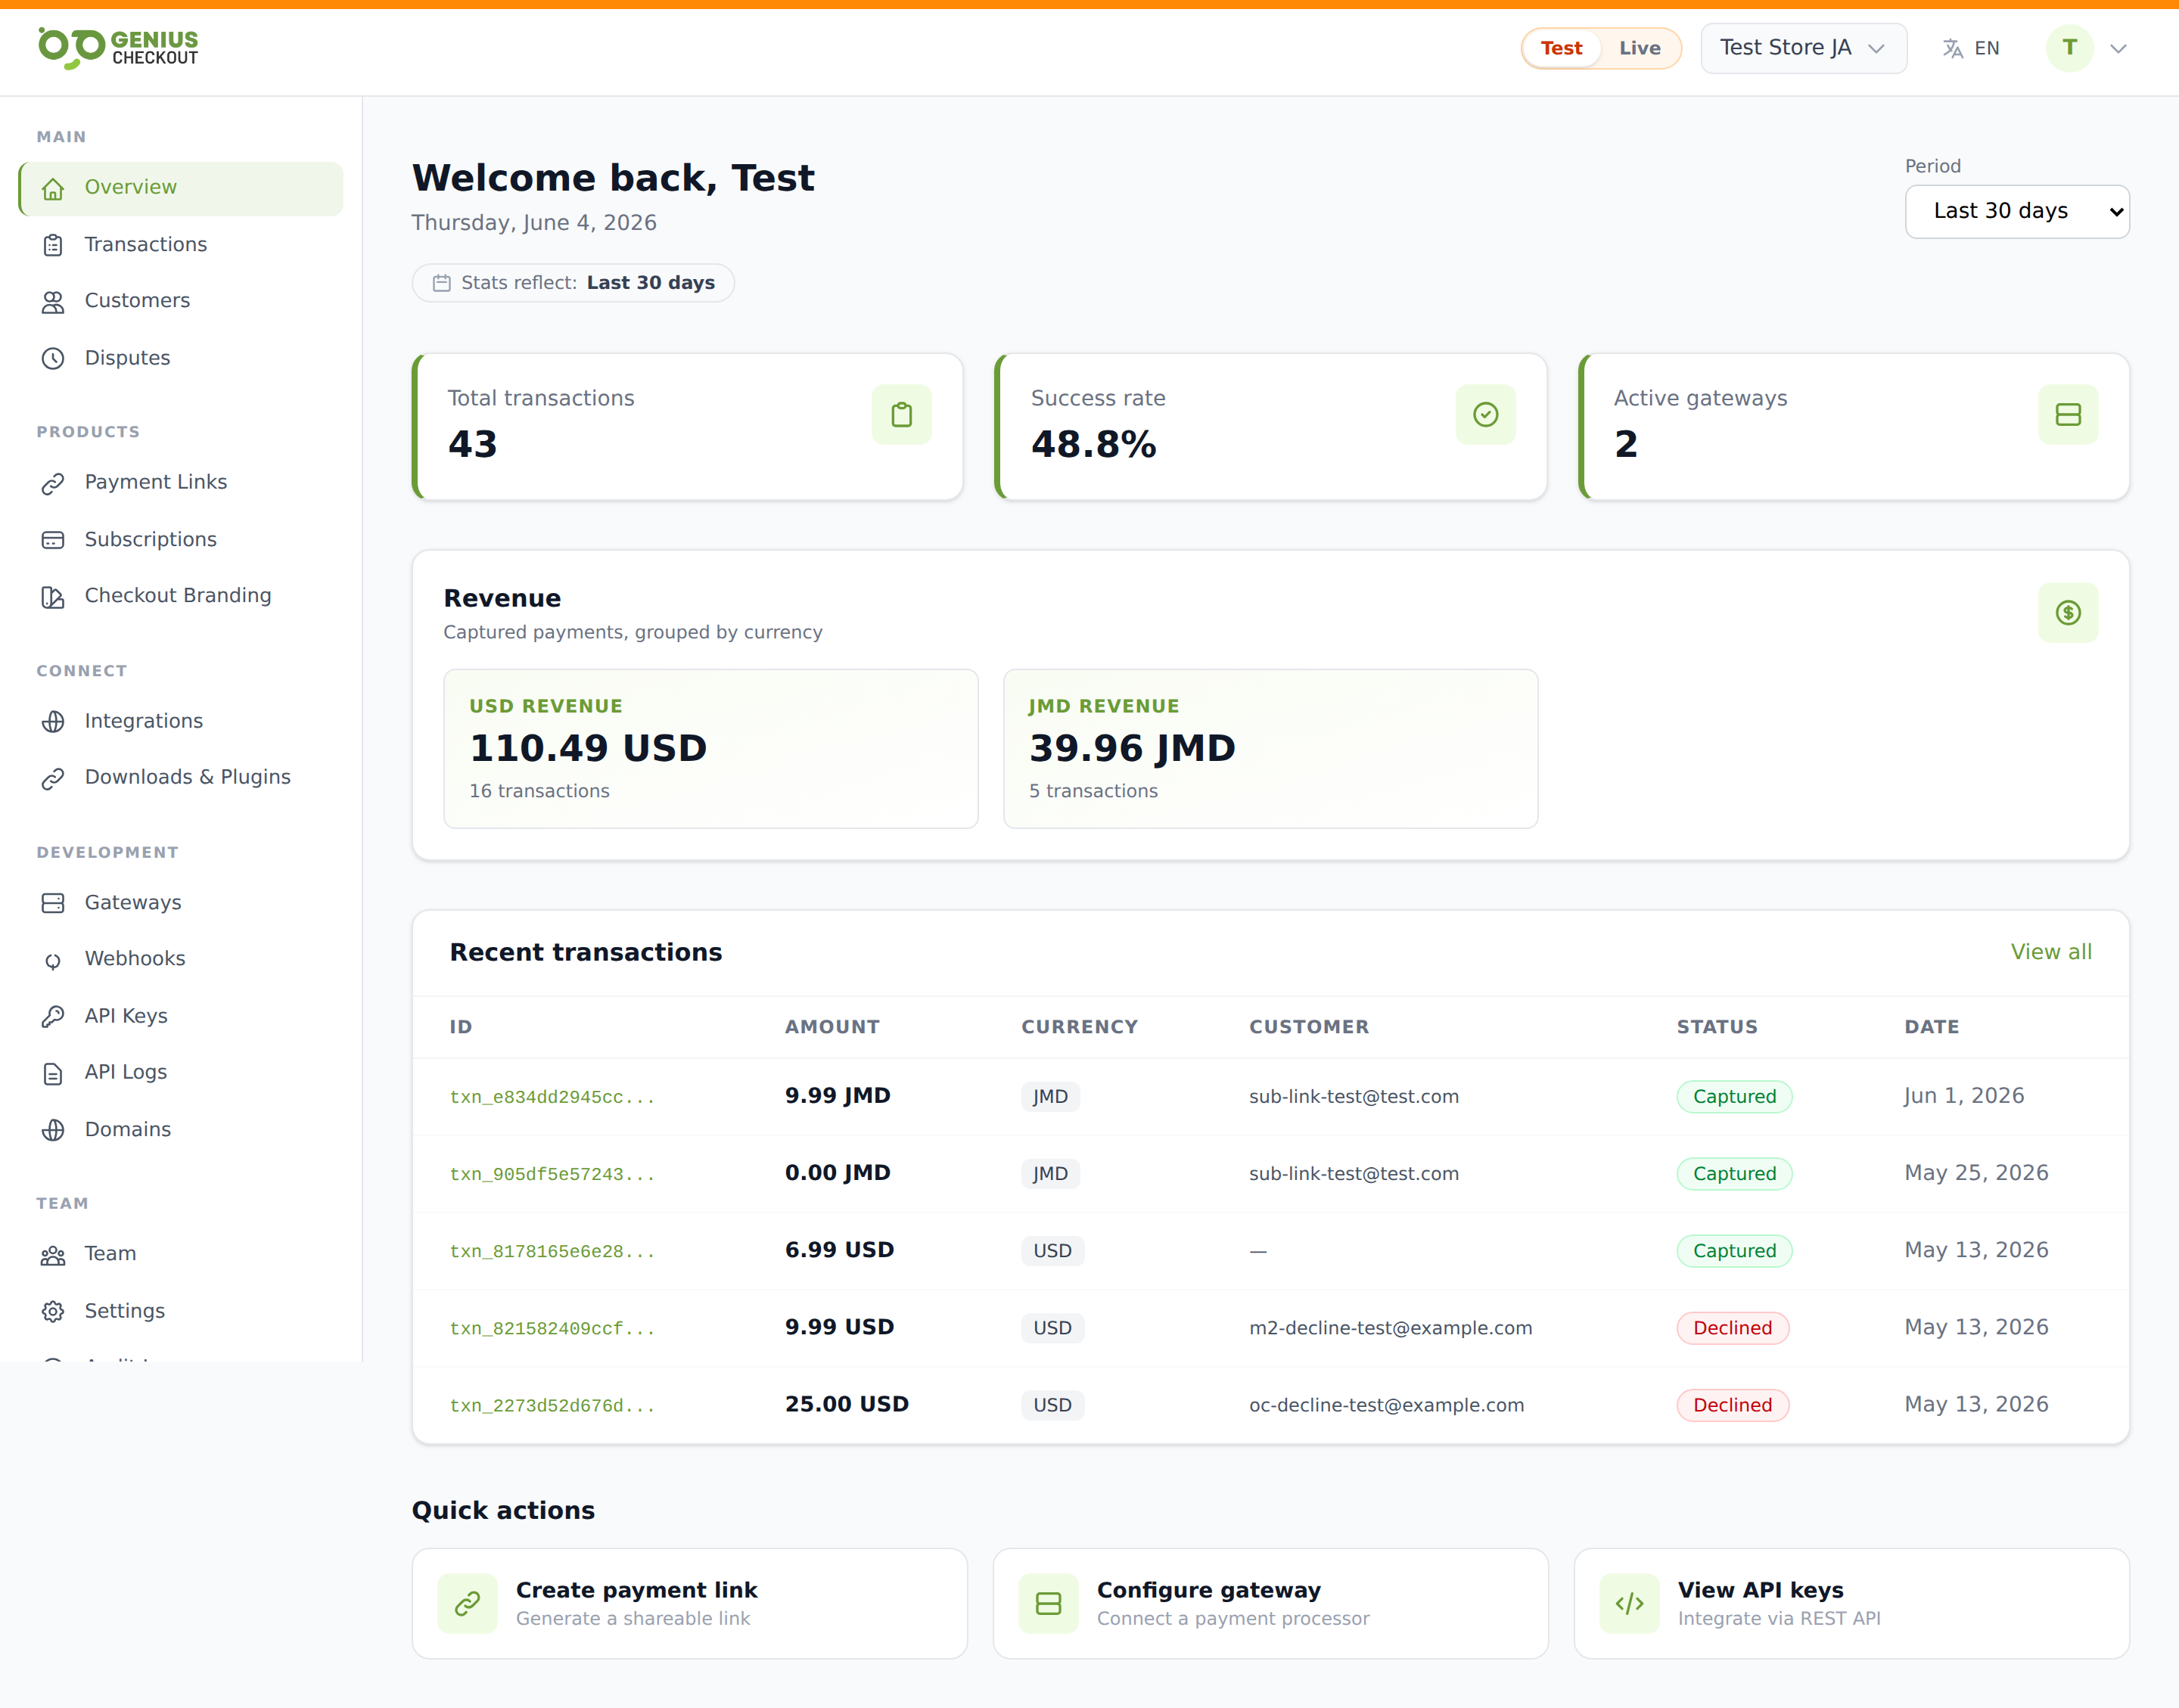
The Dashboard is the first thing you land on when you log into the merchant portal. It surfaces the headline numbers for your account — transactions, revenue, gateway health — and lets you slice them across any time window.
Every figure on the dashboard reflects exactly one of test or live mode, never both. The active mode is set by the test/live toggle in the top bar. See Test Mode vs Live Mode.
Period selector
The period picker at the top of the page controls every KPI on the dashboard. Choose from:
- Last 7 days
- Last 30 days (default)
- Last 90 days
- Year to date
- All time
- Custom — pick a
fromandtodate
The label updates with the picked range so you always know what window the numbers reflect.
KPI tiles
Three tiles run across the top:
- Total transactions — count of every transaction (any status) created in the period.
- Success rate — percentage of transactions that landed in
capturedorauthorizedstatus. A drop here is the first sign of a gateway or 3DS configuration regression. - Active gateways — number of gateway configurations marked active. This is one of the few metrics that is not mode-scoped — a single gateway config can carry both test and live credentials.
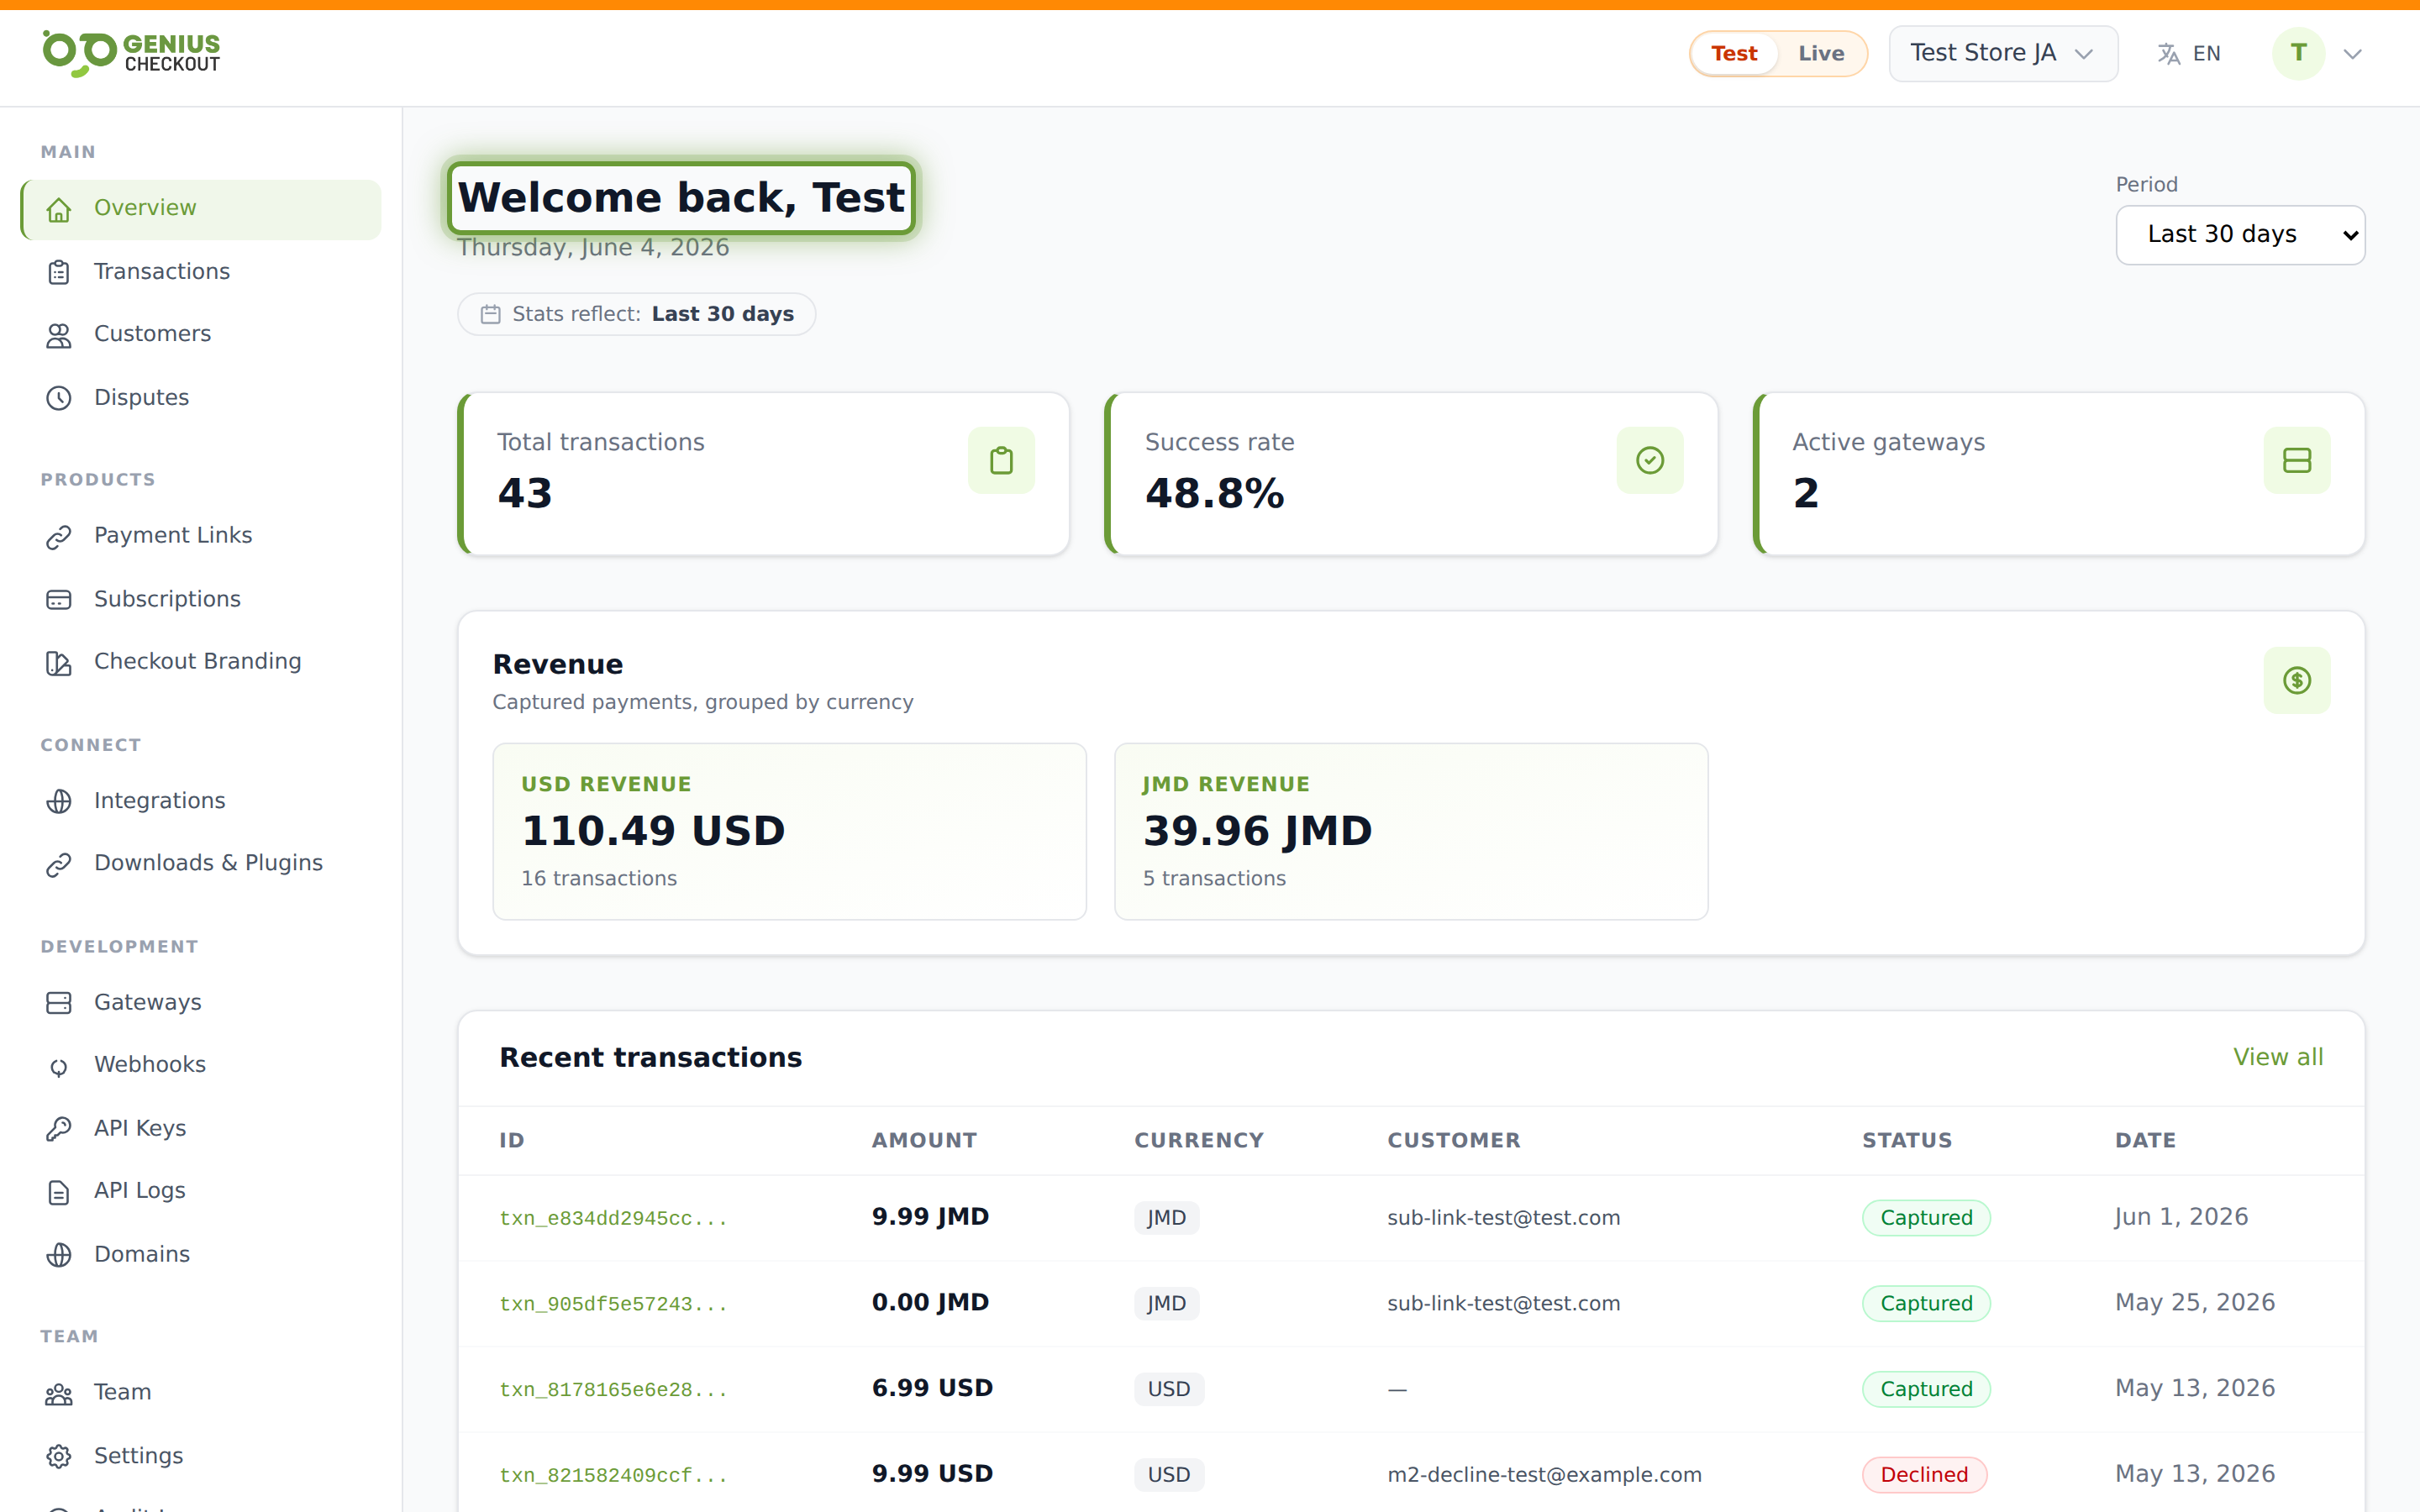
Revenue by currency
Genius Checkout doesn't roll currencies into a single total — every currency stays in its own bucket. The Revenue card lists each currency you've collected in, with:
- The captured total (
SUM(amount)acrossstatus = captured) - The transaction count behind that total
If you ran a campaign that took JMD, USD, and TTD, you'll see three rows. Sorted by captured-total descending.
Recent activity
The dashboard shows the 5 most recent transactions in your active view-mode. Each row links to the Transaction Detail page. For the full list, head to Viewing Transactions.
Onboarding checklist
If your account is new (no transactions yet, no active gateway), the dashboard also renders a step-by-step setup checklist:
- Configure a gateway — links to Adding a Gateway.
- Take your first test transaction.
- Connect an integration — links to Integrations Overview.
Each step ticks off as you complete it. The checklist disappears once you have an active gateway and at least one transaction.
Refreshing
Stats are computed on every page load — there's no caching layer. If you just took a payment, refreshing the dashboard immediately reflects it. The trade-off is that very large accounts (millions of transactions) see slightly slower loads on the All time preset. If that's you, prefer Last 90 days for day-to-day work and use Exporting Data for full-history reconciliation.